
 JMA / Wikimedia Commons · CC BY 4.0 01
 Typhoon Tracking
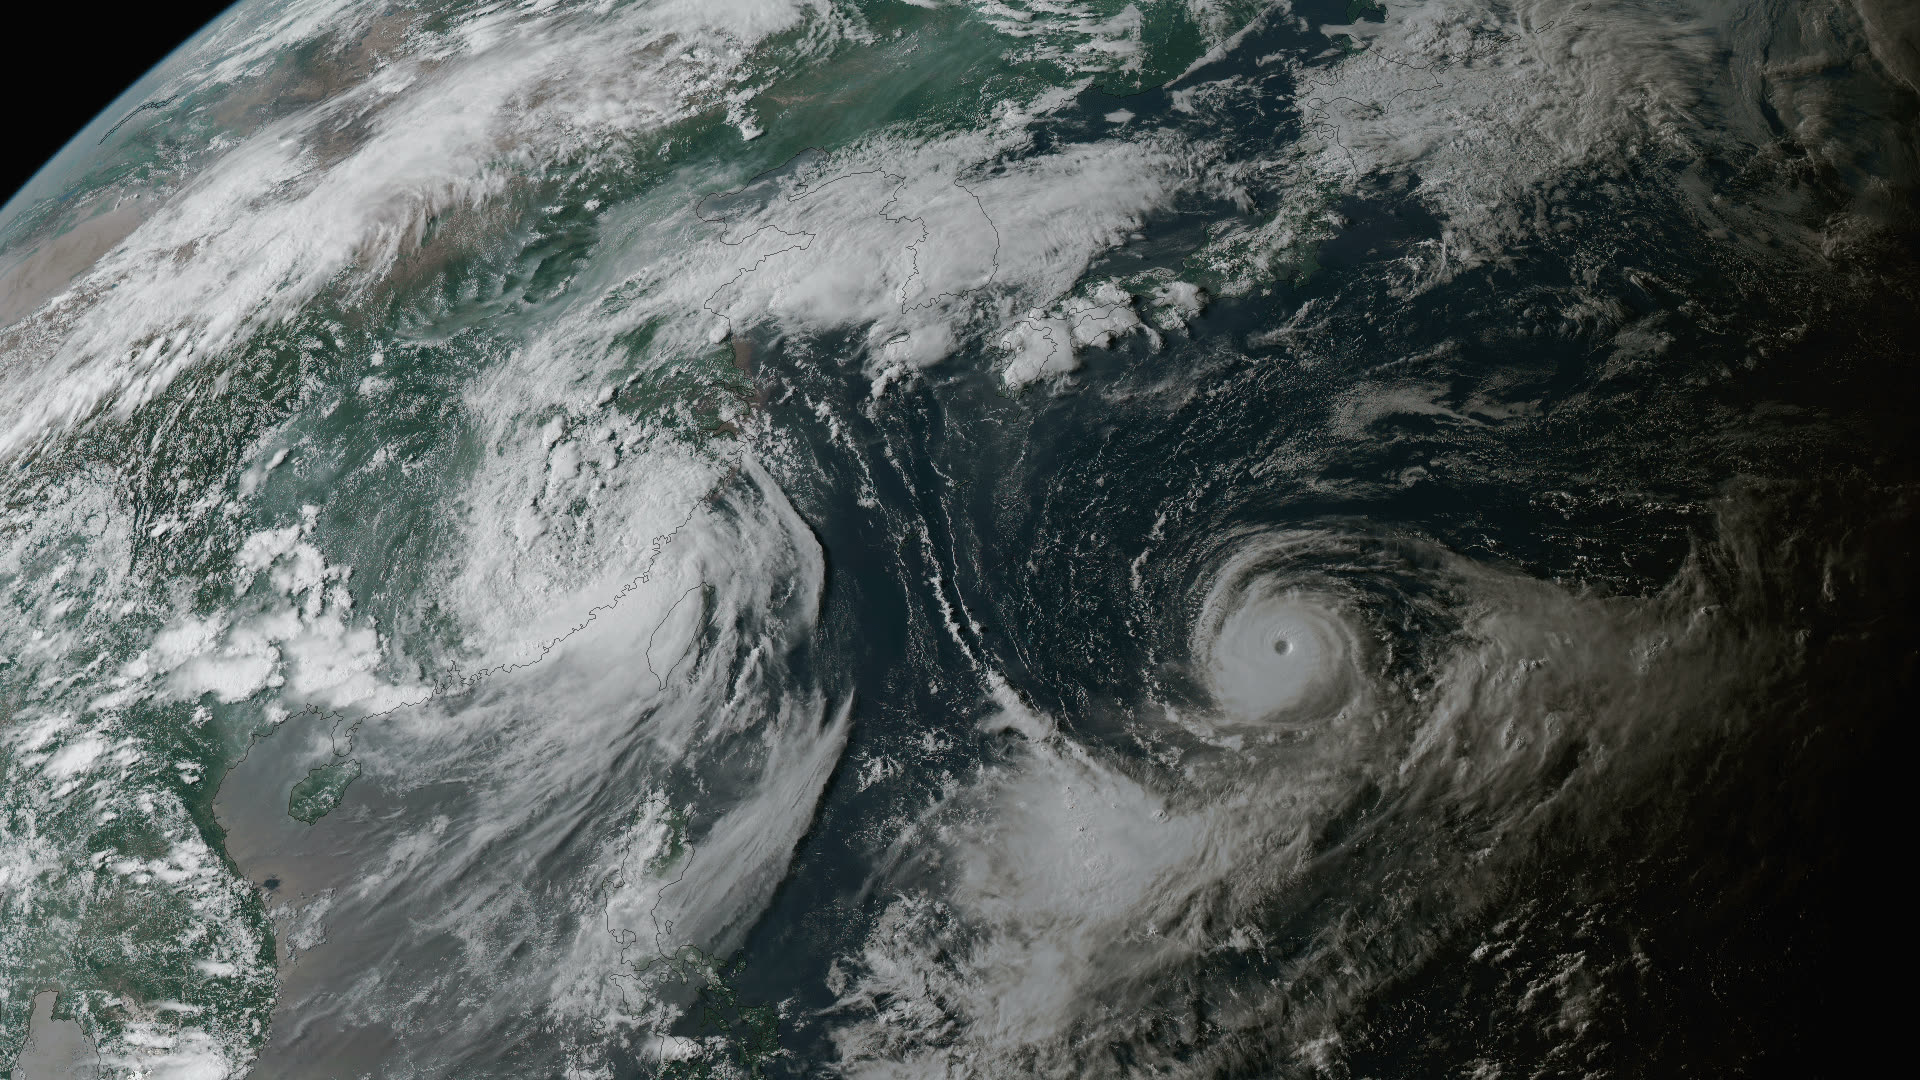
Satellite and radar track genesis, movement and landfall in real time, buying precious hours for disaster decisions.
SOMETHING IS COMING
The next sky is on its way.
Professional Weather Analysis Platform
Professional, without the complexity
Atmoseq brings satellite, radar and live observations together and delivers physical quantities straight to your screen — real-time visualization, custom rendering, alerts and timeline replay, for weather enthusiasts, professionals and academics.
Scroll down, keep exploring
Core Features
Keep scrolling to glide through the six data pipelines of Atmoseq.
01 / Satellite
A full-disk scan every 10 minutes, with day-night true color and infrared brightness temperature — from a single cloud to a typhoon, nothing hides.
02 / Radar
A fresh frame every 6 minutes — about 250 single sites plus 8 regional mosaics — so every jump of a convective cell is caught.
03 / Relief
A relief cloud view inverted from infrared brightness temperature, lit in real time, day and night — clouds gain height for the first time.
04 / Render
What reaches your screen is not a picture but the physical quantities themselves. Decode once, restyle instantly — colormaps, ranges and opacity are yours to define.
05 / Replay
Satellite and radar move along one shared timeline with concurrent layer playback — every weather event can be fully revisited.
06 / Life
Real-time weather, 3-day forecasts and alert push — plus a sunset-glow quality forecast for those who chase the light.
By the numbers
0 min
Full-disk satellite scan
0 min
Radar network cadence
0 +
Registered radar sites
0 km
Sub-satellite resolution
Use cases
Keep scrolling to sweep sideways through three real battlefields.
JMA / Wikimedia Commons · CC BY 4.0 01 Satellite and radar track genesis, movement and landfall in real time, buying precious hours for disaster decisions.
 NOAA / Wikimedia Commons 02
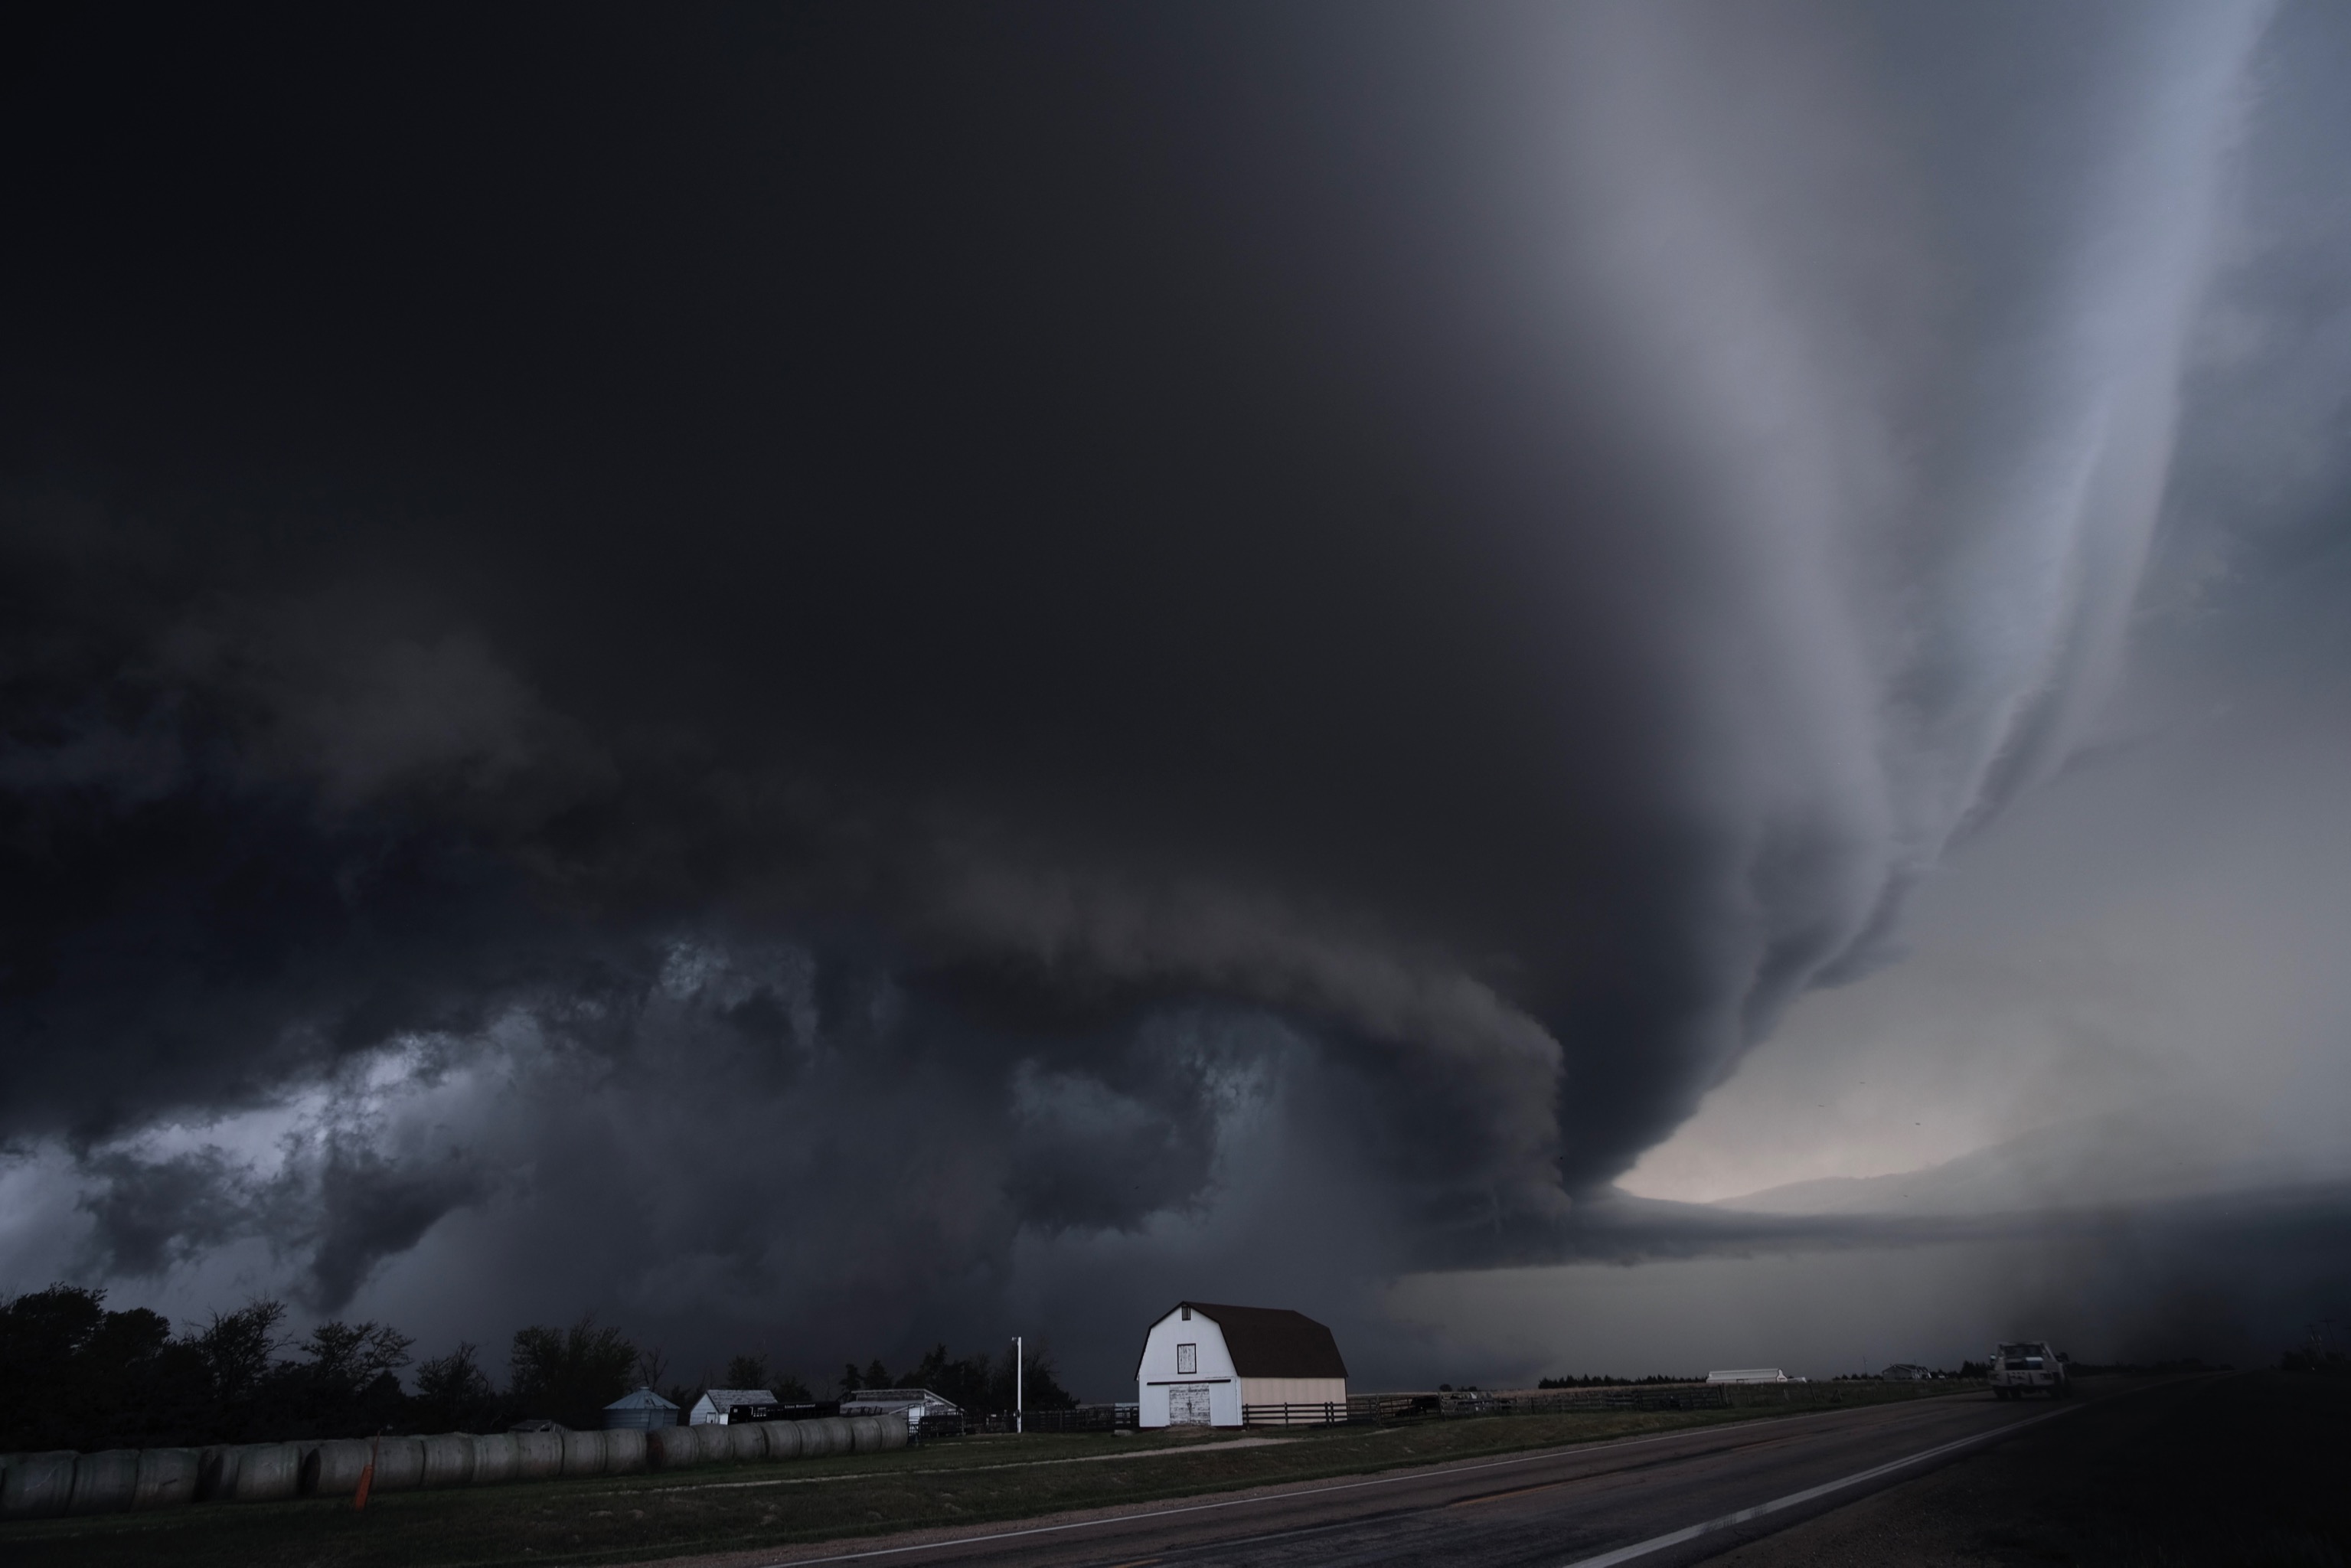
 Radar mosaics keep an unblinking eye on severe convection and flash heavy rain — no echo jump escapes you.
 Pexels 03
 Sunset-glow quality and 4-day probability forecasts — plan every chase and never come home empty-handed.
Pipeline
STEP 01
Satellite, radar and surface observations flow in continuously.
STEP 02
Quality control, reprojection and spatiotemporal alignment make heterogeneous data speak one language.
STEP 03
Standardized cloud-optimized raster products are composed, written to disk and indexed in space and time.
STEP 04
A priority queue pushes data with low latency — the fastest link reaches you first.
STEP 05
Driven by our in-house rendering engine, multi-source layers stack with free-form animation.
STEP 06
Replay along the timeline, probe values and compare — a complete debrief of every event.
Experience professional weather analysis and visualization with Atmoseq — let every decision be backed by data.